Amazing opensource tool for assessing 12 water risks (agriculture, navigation, ..., etc.) ... Monte
Aqueduct.wri.org/atlas - Map

The World Resources Institute is committed to transparency and open data. The data and methodology behind Aqueduct are documented and available for download. All the products, methodologies, and datasets that make up Aqueduct are available for free use under the Creative Commons CC:BY license.
To learn more about Aqueduct, or provide feedback, please contact our team.
Aqueduct.wri.org/about - About
Aqueduct, a new tool from the World Resources Institute, lets you see all the bad things that might stem from water, from droughts to floods and beyond.
Remember the drought that hit the U.S. in 2012? It was a big deal, even if it didn’t personally affect you. In fact, 53% of the country was dealing with what the USDA calls "moderate to extreme drought" by July. Over 1,000 counties were declared federal disaster areas.
Aqueduct, a new map from the World Resources Institute (WRI), throws the world’s growing water woes into stark relief. "We’re seeing that water and the lack of it is emerging as one of the defining challenges of the 21st century. What’s interesting now is that we’re hearing that concern echoed in the business community and across the world," says Betsy Otto, Director of Aqueduct for WRI.

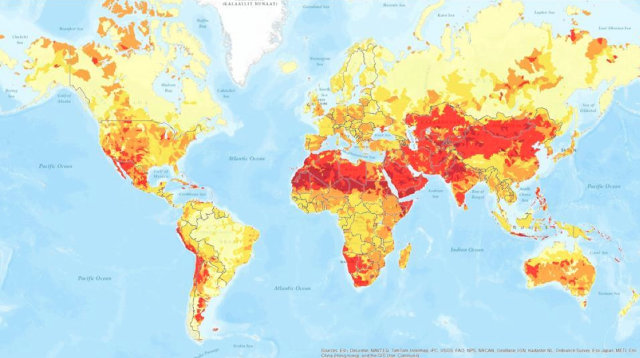
The world’s water risks. Riskier regions are in red.
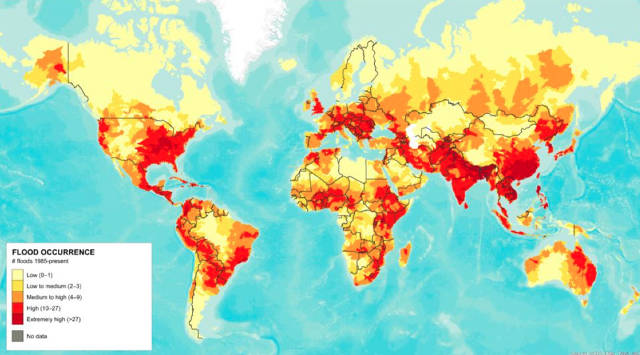
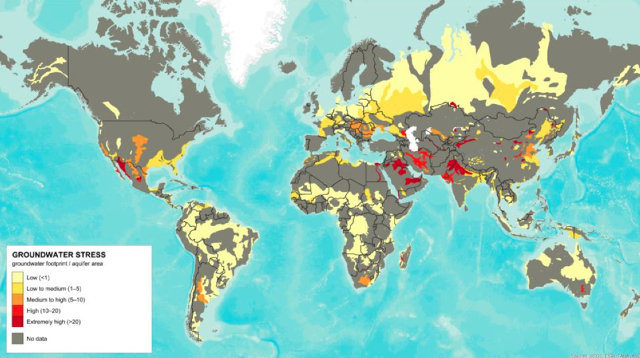
The project, created with an alliance of companies including GE, Goldman Sachs, Shell, and Procter & Gamble, is the highest high-resolution map of global water stress available today. It’s also the first water-risk mapping tool to include a layer for groundwater data. WRI’s free map uses 2010 data (the most current data available) to measure a number of categories of water risk around the world: physical risk; variability in available water from year to year, which looks at flood occurrences (how often and how intense); severity of droughts (how long and how severe), groundwater stress, pollution pressure, demand for water treatment, media coverage about water issues (meaning how much attention is given to water in a given area), and more.
"The beauty of the tool is that it allows you to look at individual indicators but richly layers all of those together and aggregates them to give an overall water-risk picture," says Otto. If you’re not sure what layers you want to see, Aqueduct has nine predetermined indicator weightings sorted by industry sector--an oil and gas company, for example, will have different risk factors that it wants to look at than a company in another industry.

World flood risks
"We set the water risk framework to speak to the business community, to the private sector, but we’re getting good feedback that the public sector and NGOs are going to use this information. There’s a dearth of good information globally about where we stand with water challenges, and we’re only going to be able to solve water problems if we bring the public and private sector together," says Otto.

"We set the water risk framework to speak to the business community, to the private sector, but we’re getting good feedback that the public sector and NGOs are going to use this information. There’s a dearth of good information globally about where we stand with water challenges, and we’re only going to be able to solve water problems if we bring the public and private sector together," says Otto.

Threatened amphibian species
Otto discovered a number of striking things while putting together the map. Places that haven’t traditionally had high water risks--the East Coast of the United States, the upper Midwest, Europe--now have medium to high water risk. This is because of changes in water demand, withdrawal patterns, weather, and water-supply patterns. At the same time, places where there’s already high competition for water (i.e. India) are at serious risk when combined with annual variability in water. "When thinking about resilience in the face of risk, it’s not just baseline stress, but what the disruptions are that could really wreak havoc," explains Otto.
Check out the map here.


No comments:
Post a Comment